
Network🕸️
- Jean-Christophe Miler
- Network , Technology
- August 15, 2025
Table of Contents
Networking Exploration
Lab - Mapping the Internet
Part 1: Test Network Connectivity Using Ping
To trace the route to a distant network, the PC used must have a working connection to the Internet.
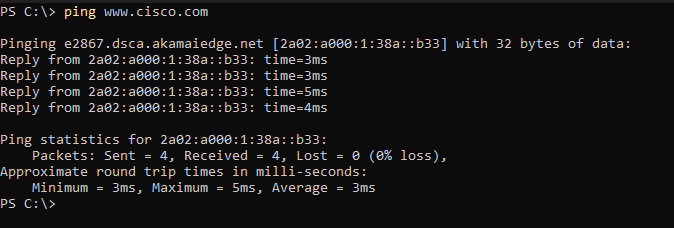
The first tool we will use is ping. Ping is a tool used to test whether a host is reachable. Packets of information are sent to the remote host with instructions to reply. Your local PC measures whether a response is received to each packet, and how long it takes for those packets to cross the network. The name ping comes from active sonar technology in which a pulse of sound is sent underwater and bounced off of terrain or other ships.
From Windows, press Windows Button + R, type powershell in the Search box, and then press Enter
At the command-line prompt, type ping www.cisco.com
Part 2: Trace a Route to a Remote Server Using Tracert
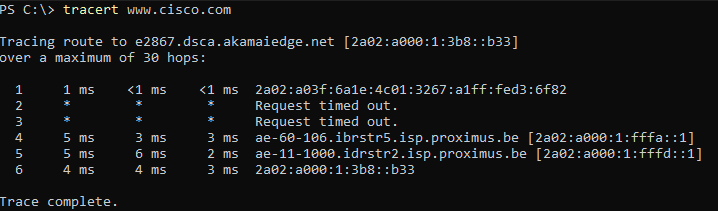
Now that basic reachability has been verified by using the ping tool, it is helpful to look more closely at each network segment that is crossed. To do this, the tracert tool will be used.
- At the command-line prompt, type tracert www.cisco.com.
Part 3: Trace a Route to a Remote Server Using Web-Based
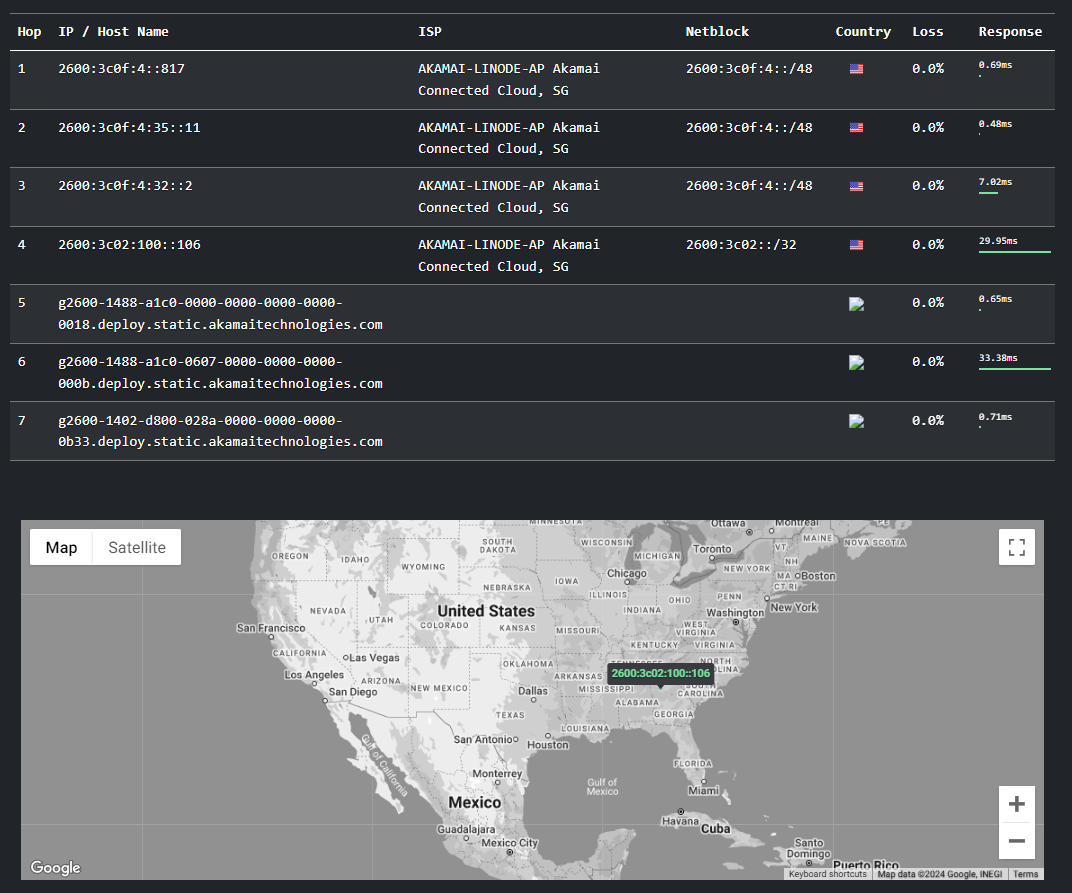
- Using https://traceroute-online.com/ and trace the route to the following website: www.cisco.com
IOS
Packet Tracer - Navigating the IOS
Objectives
Part 1: Basic Connections, Accessing the CLI and Exploring Help
Part 2: Exploring EXEC Modes
Part 3: Setting the Clock
Background
In this activity, you will practice skills necessary for navigating the Cisco IOS, including different user access modes, various configuration modes, and common commands you use on a regular basis. You also practice accessing the context-sensitive Help by configuring the clock command.
Part 1: Basic Connections, Accessing the CLI and Exploring Help
In Part 1 of this activity, you connect a PC to a switch using a console connection and explore various command modes and Help features.
Step 1: Connect PC1 to S1 uses a console cable.
Click the Connections icon (the one that looks like a lightning bolt) in the lower left corner of the Packet Tracer window.
Select the light blue Console cable by clicking it. The mouse pointer will change to what appears to be a connector with a cable dangling off of it.
Click PC1; a window displays an option for an RS-232 connection.
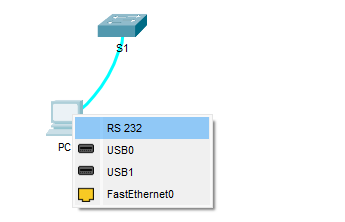
Drag the other end of the console connection to the S1 switch and click the switch to bring up the connection list.
Select the Console port to complete the connection.
Step 2: Establish a terminal session with S1.
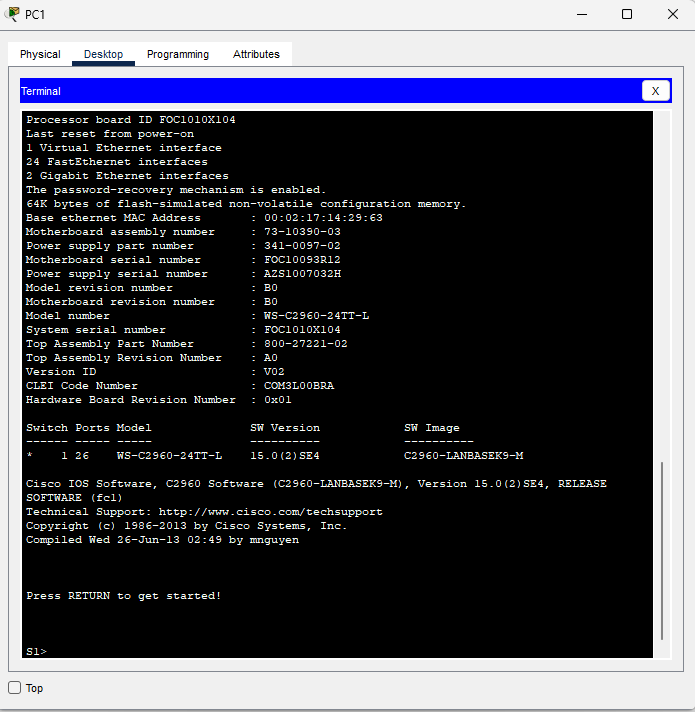
Click PC1 and then select the Desktop tab.
Click the Terminal application icon; verify that the Port Configuration default settings are correct.
Click OK.
The screen that appears may have several messages displayed. Somewhere on the display there should be a Press RETURN to get started! message. Press ENTER.
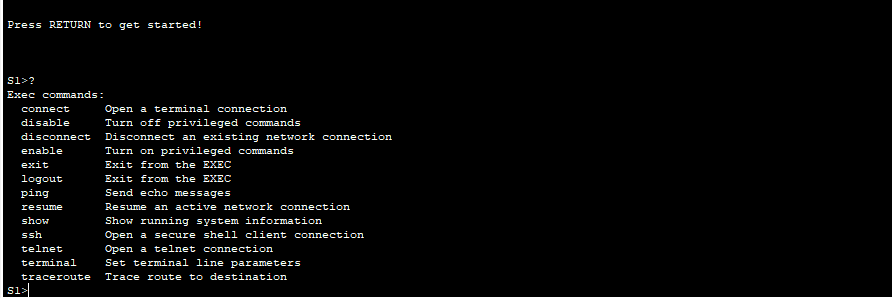
Step 3: Explore the IOS Help.
- The IOS can provide help for commands depending on the level being accessed. The prompt currently being displayed is called User EXEC and the device is waiting for a command. The most basic form of help is to type a question mark (?) at the prompt to display a list of commands.
- At the prompt, type t, followed by a question mark (?).

- At the prompt, type te, followed by a question mark (?).

This type of help is known as context-sensitive Help, providing more information as the commands are expanded.
Part 2: Exploring EXEC Modes
In Part 2 of this activity, you switch to privileged EXEC mode and issue additional commands.
Step 1: Enter privileged EXEC mode.
What information is displayed that describes the enable command?
- Type en and press the Tab key.

This is called command completion or tab completion. When part of a command is typed, the Tab key can be used to complete the partial command. If the characters typed are enough to make the command unique, as in the case with the enable command, the remaining portion is displayed.
What would happen if you were to type te
Enter the enable command and press ENTER. How does the prompt change?
When prompted, type the question mark (?).
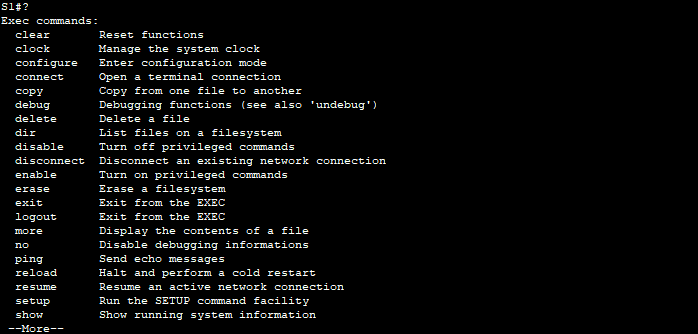
Previously there was one command that started with the letter ‘C’ in user EXEC mode. How many commands are displayed now that privileged EXEC mode is active? (Hint: you could type c? to list just the commands beginning with ‘C’.)
Step 2: Enter Global Configuration mode.
- One of the commands starting with the letter ‘C’ is configure when in Privileged EXEC mode. Type either the full command or enough of the command to make it unique along with the
key to issue the command and press .

- Press the
key to accept the default parameter enclosed in brackets [terminal].

- This is called global configuration mode. This mode will be explored further in upcoming activities and labs. For now exit back to Privileged EXEC mode by typing end, exit or Ctrl-Z.
Part 3: Setting the Clock
Step 1: Use the clock command.
- Use the clock command to further explore Help and command syntax. Type show clock at the privileged EXEC prompt.

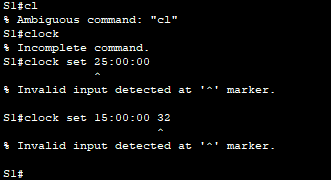
- The % Incomplete command message is returned by the IOS indicating that the clock command needs further parameters. Any time more information is needed help can be provided by typing a space after the command and the question mark (?).

- Set the clock using the clock set command. Continue proceeding through the command one step at a time.

What would have been displayed if only the clock set command had been entered and no request for help was made by using the question mark?
- Based on the information requested by issuing the clock set ? command, enter a time of 3:00 p.m. by using the 24-hour format of 15:00:00. Check to see if further parameters are needed.

The output returns the request for more information:
<1-31> Day of the month
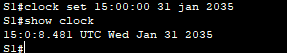
MONTH Month of the year
- Attempt to set the date to 01/31/2035 using the format requested. It may be necessary to request additional help using the context-sensitive Help to complete the process. When finished, issue the show clock command to display the clock setting. The resulting command output should display as:
- If you were not successful, try the following command to obtain the output above:
Step 2: Explore additional command messages.
The IOS provides various outputs for incorrect or incomplete commands as experienced in earlier sections. Continue to use the clock command to explore additional messages that may be encountered as you learn to use the IOS.
Issue the following command and record the messages:
Protocols
Packet Tracer - Investigating the TCP/IP and OSI Models in Action
Objectives
Part 1: Examine HTTP Web Traffic
Part 2: Display Elements of the TCP/IP Protocol Suite
Background
This simulation activity is intended to provide a foundation for understanding the TCP/IP protocol suite and the relationship to the OSI model. Simulation mode allows you to view the data contents being sent across the network at each layer.
As data moves through the network, it is broken down into smaller pieces and identified so that the pieces can be put back together when they arrive at the destination. Each piece is assigned a specific name (protocol data unit [PDU]) and associated with a specific layer of the TCP/IP and OSI models. Packet Tracer simulation mode enables you to view each of the layers and the associated PDU. The following steps lead the user through the process of requesting a web page from a web server by using the web browser application available on a client PC.
Even though much of the information displayed will be discussed in more detail later, this is an opportunity to explore the functionality of Packet Tracer and be able to visualize the encapsulation process.
Part 1: Examine HTTP Web Traffic
In Part 1 of this activity, you will use Packet Tracer (PT) Simulation mode to generate web traffic and examine HTTP.
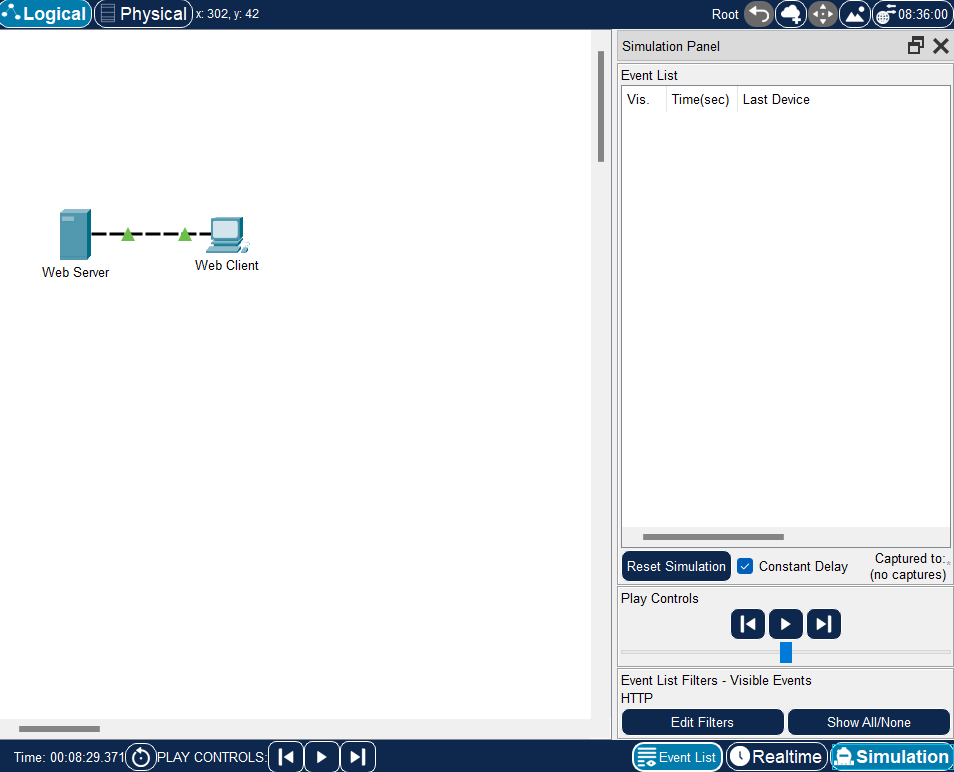
Step 1: Switch from Realtime to Simulation mode.
In the lower right corner of the Packet Tracer interface are tabs to toggle between Realtime and Simulation mode. PT always starts in Realtime mode, in which networking protocols operate with realistic timings. However, a powerful feature of Packet Tracer allows the user to “stop time” by switching to Simulation mode. In Simulation mode, packets are displayed as animated envelopes, time is event driven, and the user can step through networking events.
Click the Simulation mode icon to switch from Realtime mode to Simulation mode.
Select HTTP from the Event List Filters.
HTTP may already be the only visible event. Click Edit Filters to display the available visible events. Toggle the Show All/None check box and notice how the check boxes switch from unchecked to checked or checked to unchecked, depending on the current state.
Click the Show All/None check box until all boxes are cleared and then select HTTP. Click anywhere outside of the Edit Filters box to hide it. The Visible Events should now only display HTTP.
Step 2: Generate web (HTTP) traffic.
Currently the Simulation Panel is empty. There are six columns listed across the top of the Event List within the Simulation Panel. As traffic is generated and stepped through, events appear in the list. The Info column is used to inspect the contents of a particular event.
Note: The Web Server and Web Client are displayed in the left pane. The panels can be adjusted in size by hovering next to the scroll bar and dragging left or right when the double-headed arrow appears.
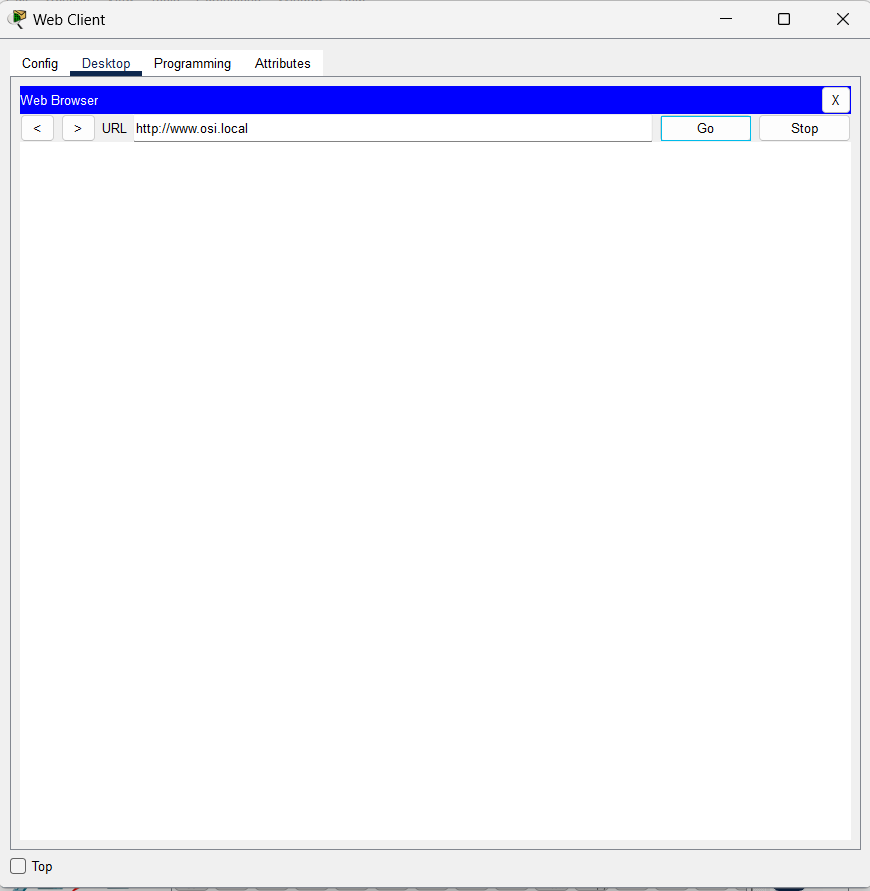
Click Web Client in the far left pane.
Click the Desktop tab and click the Web Browser icon to open it.
In the URL field, enter www.osi.local and click Go.
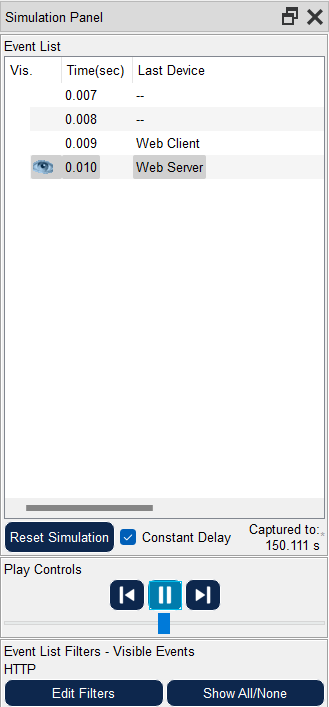
Because time in Simulation mode is event-driven, you must use the Capture/Forward button to display network events.
- Click Capture/Forward four times. There should be four events in the Event List.
Step 3: Explore the contents of the HTTP packet.
- Click the first colored square box under the Event List > Info column. It may be necessary to expand the Simulation Panel or use the scrollbar directly below the Event List.
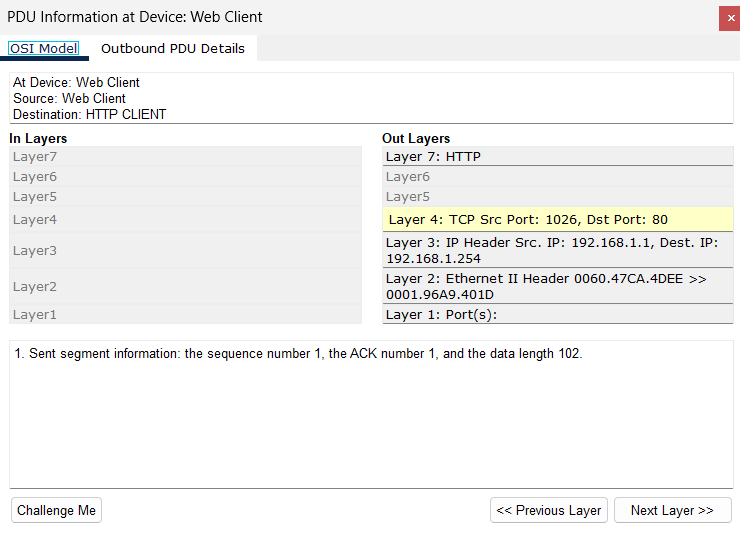
The PDU Information at Device: Web Client window displays. In this window, there are only two tabs (OSI Model and Outbound PDU Details) because this is the start of the transmission. As more events are examined, there will be three tabs displayed, adding a tab for Inbound PDU Details. When an event is the last event in the stream of traffic, only the OSI Model and Inbound PDU Details tabs are displayed.
- Ensure that the OSI Model tab is selected. Under the Out Layers column, ensure that the Layer 7 box is highlighted.
What information is listed in the numbered steps directly below the In Layers and Out Layers boxes?
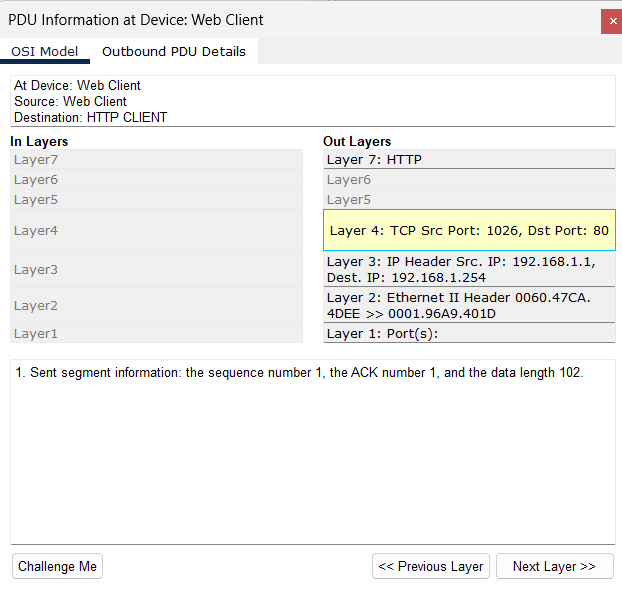
- Click Next Layer. Layer 4 should be highlighted.
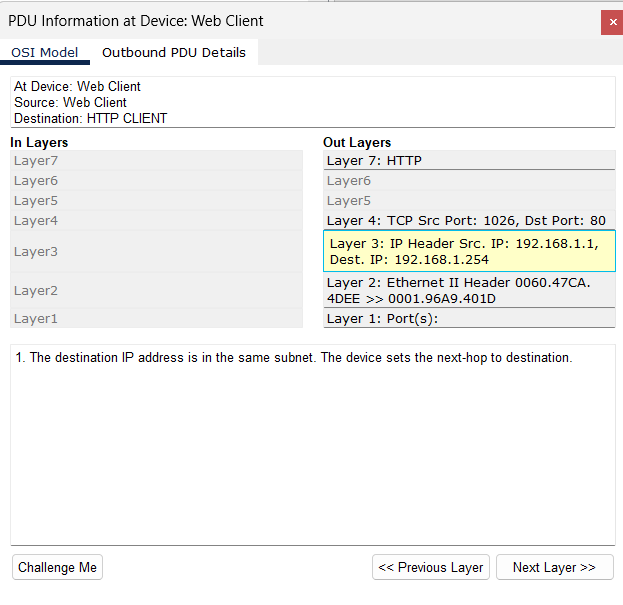
- Click Next Layer. Layer 3 should be highlighted. What is the Dest. IP value?
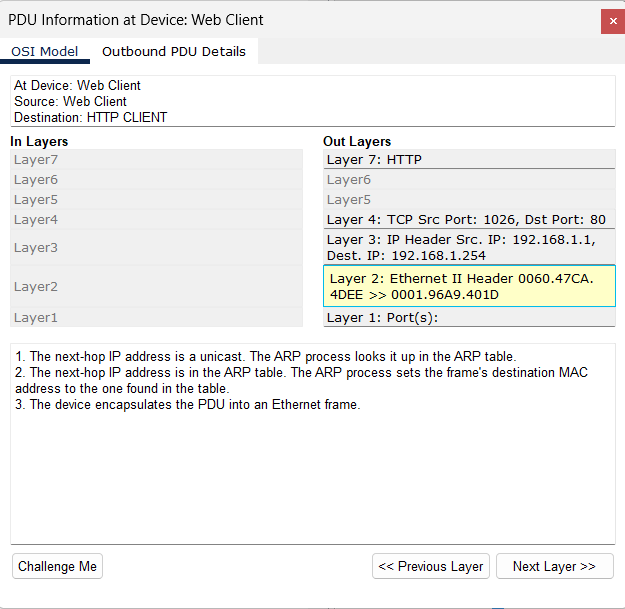
- Click Next Layer. What information is displayed at this layer?
- Click the Outbound PDU Details tab.
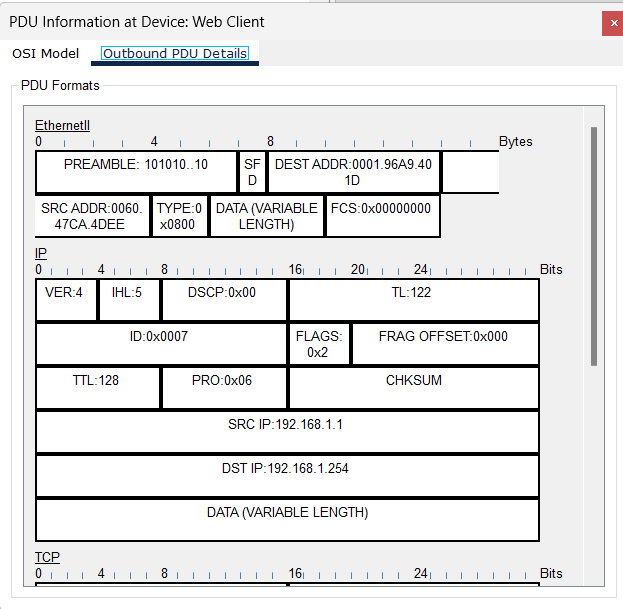
Information listed under the PDU Details is reflective of the layers within the TCP/IP model.
Note: The information listed under the Ethernet II section provides even more detailed information than is listed under Layer 2 on the OSI Model tab. The Outbound PDU Details provides more descriptive and detailed information. The values under DEST MAC and SRC MAC within the Ethernet II section of the PDU Details appear on the OSI Model tab under Layer 2, but are not identified as such.
Click the next colored square box under the Event List > Info column. Only Layer 1 is active (not grayed out). The device is moving the frame from the buffer and placing it on to the network.
Advance to the next HTTP Info box within the Event List and click the colored square box. This window contains both In Layers and Out Layers. Notice the direction of the arrow directly under the In Layers column; it is pointing upward, indicating the direction the information is travelling. Scroll through these layers making note of the items previously viewed. At the top of the column the arrow points to the right. This denotes that the server is now sending the information back to the client.
Comparing the information displayed in the In Layers column with that of the Out Layers column, what are the major differences?
- Click the Outbound PDU Details tab. Scroll down to the HTTP section.
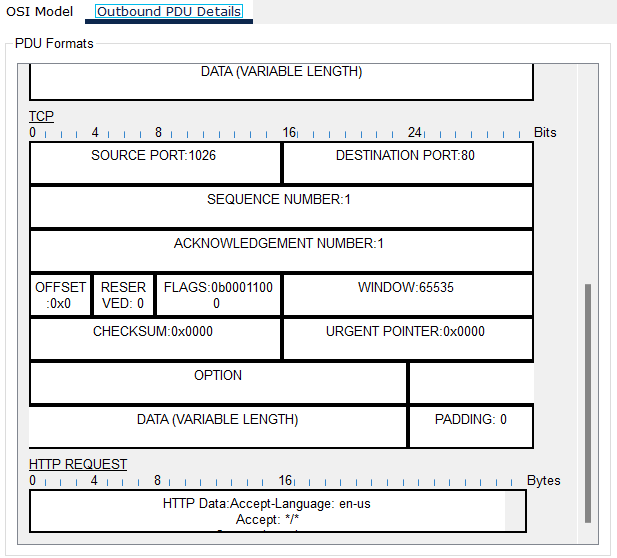
What is the first line in the HTTP message that displays?
- Click the last colored square box under the Info column. How many tabs are displayed with this event and why?
Part 2: Display Elements of the TCP/IP Protocol Suite
In Part 2 of this activity, you will use the Packet Tracer Simulation mode to view and examine some of the other protocols comprising of the TCP/IP suite.
Step 1: View Additional Events
Close any open PDU information windows.
In the Event List Filters > Visible Events section, click Show All.
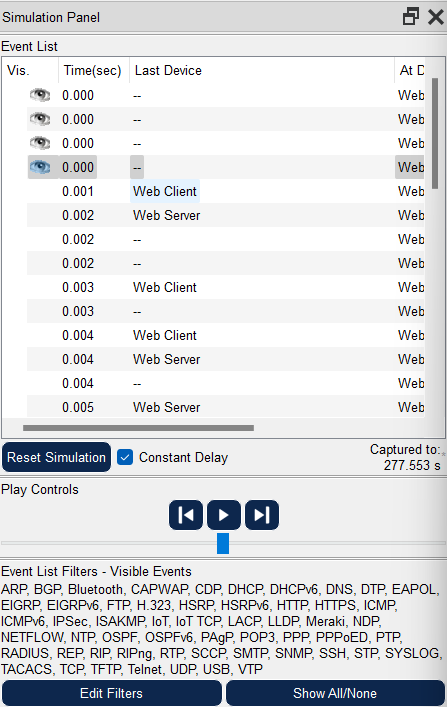
These extra entries play various roles within the TCP/IP suite. If the Address Resolution Protocol (ARP) is listed, it searches MAC addresses. DNS is responsible for converting a name (for example, www.osi.local) to an IP address. The additional TCP events are responsible for connecting, agreeing on communication parameters, and disconnecting the communications sessions between the devices. These protocols have been mentioned previously and will be further discussed as the course progresses. Currently there are over 35 possible protocols (event types) available for capture within Packet Tracer.
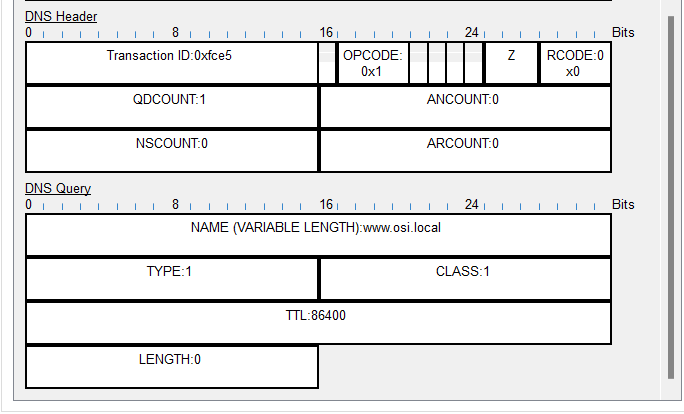
Click the first DNS event in the Info column. Explore the OSI Model and PDU Detail tabs and note the encapsulation process. As you look at the OSI Model tab with Layer 7 highlighted, a description of what is occurring is listed directly below the In Layers and Out Layers (“1. The DNS client sends a DNS query to the DNS server.”). This is very useful information to help understand what is occurring during the communication process.
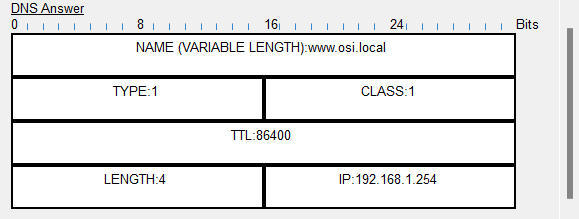
Click the Outbound PDU Details tab. What information is listed in the NAME: in the DNS QUERY section?
- Click the last DNS Info colored square box in the event list. Which device is displayed?
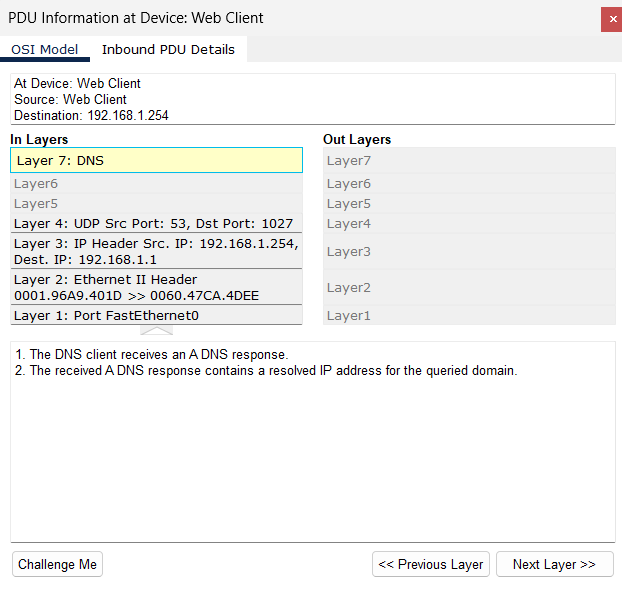
What is the value listed next to ADDRESS: in the DNS ANSWER section of the Inbound PDU Details?
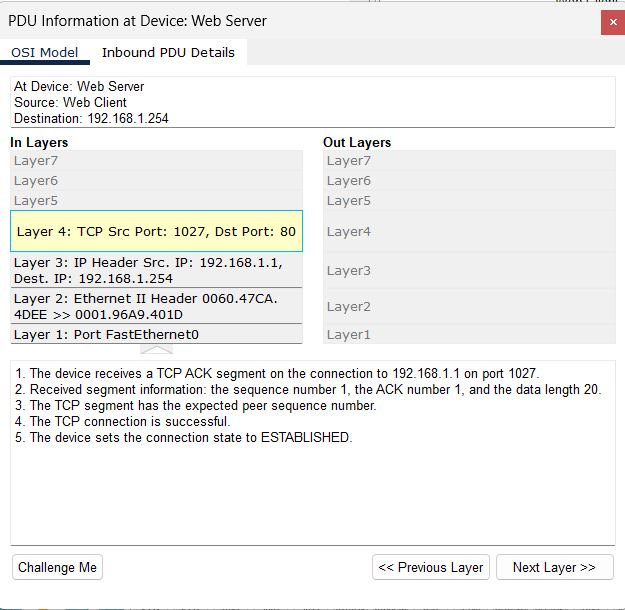
- Find the first HTTP event in the list and click the colored square box of the TCP event immediately following this event. Highlight Layer 4 in the OSI Model tab. In the numbered list directly below the In Layers and Out Layers, what is the information displayed under items 4 and 5?
TCP manages the connecting and disconnecting of the communications channel along with other responsibilities. This particular event shows that the communication channel has been ESTABLISHED.
- Click the last TCP event. Highlight Layer 4 in the OSI Model tab. Examine the steps listed directly below In Layers and Out Layers. What is the purpose of this event, based on the information provided in the last item in the list (should be item 4)?
Network Access
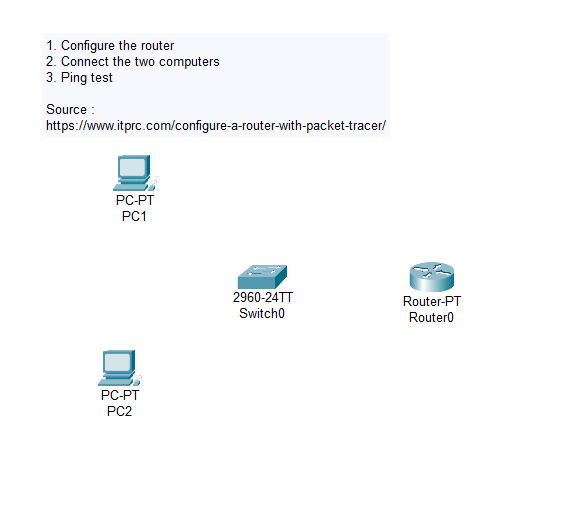
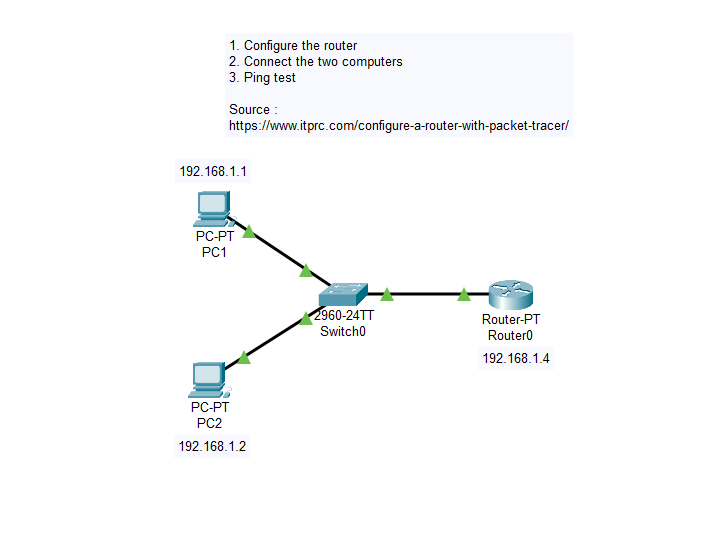
Cisco Packet Tracer: Connect Two Computers and a Router
Project Overview
This project demonstrates a basic network setup in Cisco Packet Tracer, where two computers are connected through a router. The setup will allow the two computers to communicate with each other over the network.
Requirements
Cisco Packet Tracer: Version 7.0 or later
Basic understanding of networking concepts
Topology Overview
Router: The central device that connects the two computers.
Switch: To connect many machines via a router.
Computer 1 (PC1): The first computer in the network.
Computer 2 (PC2): The second computer in the network.
Connection Type: Ethernet cables (copper straight-through cables) are used to connect the devices.
Steps to Create the Network
Launch Cisco Packet Tracer:
- Open Cisco Packet Tracer on your computer.
Add Devices to the Workspace:
- Drag and drop a Router from the “Network Devices” section.
- Drag and drop a Switch from the “Network Devices” section.
- Drag and drop two PCs from the “End Devices” section.
Connect the Devices:
Select the Copper Straight-Through Cable from the “Connections” section.
Click on PC1 and connect to the FastEthernet0/2 port on the Switch.
Connect the Router’s FastEthernet0/0 port to the switch FastEthernet0/1.
Repeat the process for PC2, connecting it to the Switch FastEthernet0/3 port.
Configure IP Addresses:
Select PC1 and go to the Desktop tab, then select IP Configuration.
Set the IP address to 192.168.1.1 with a subnet mask of 255.255.255.0
Set the default gateway to 192.168.1.4
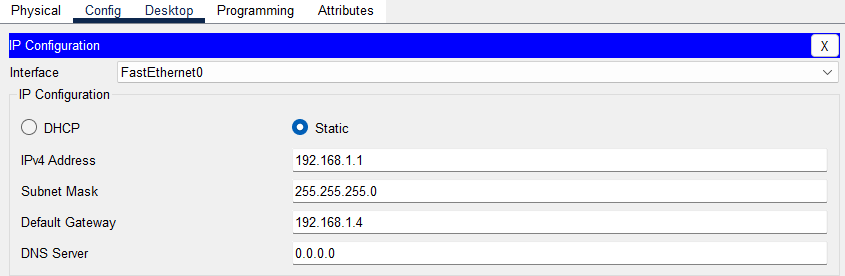
Repeat the process for PC2, setting the IP address to 192.168.1.2 and the same subnet mask and gateway.
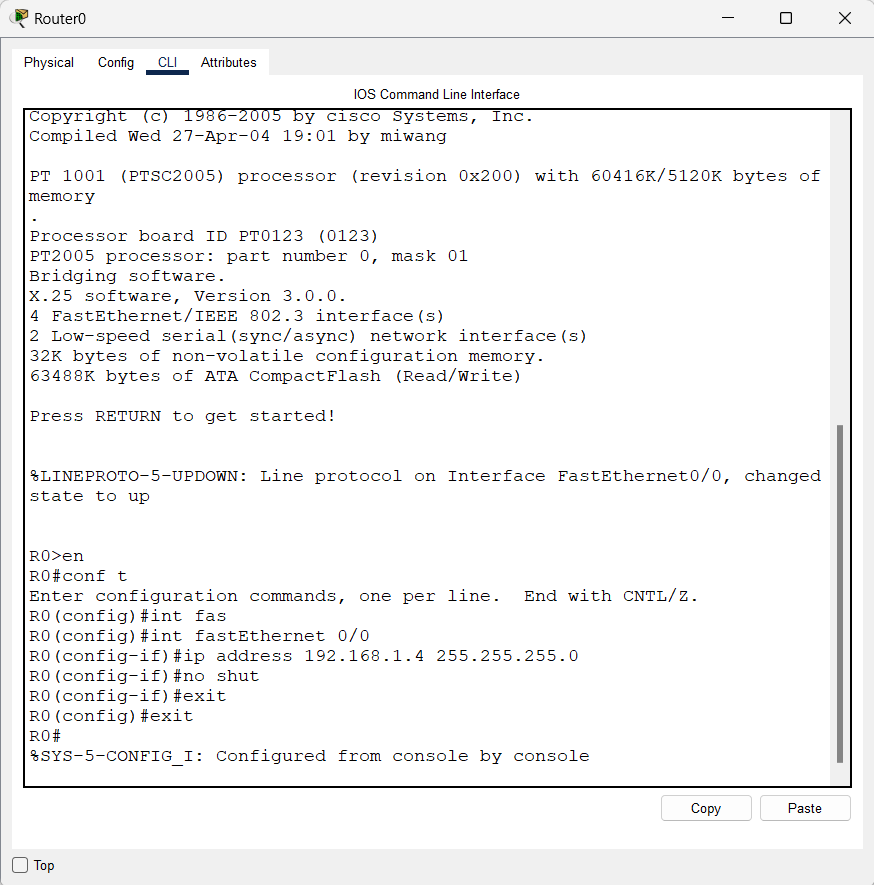
Configure the Router:
Click on the Router and go to the CLI tab.
Enter the following commands to configure the router:
Router> enable
Router# configure terminal
Router(config)# interface FastEthernet0/0
Router(config-if)# ip address 192.168.1.4 255.255.255.0
Router(config-if)# no shutdown
Router(config-if)# exit
Router(config)# exit
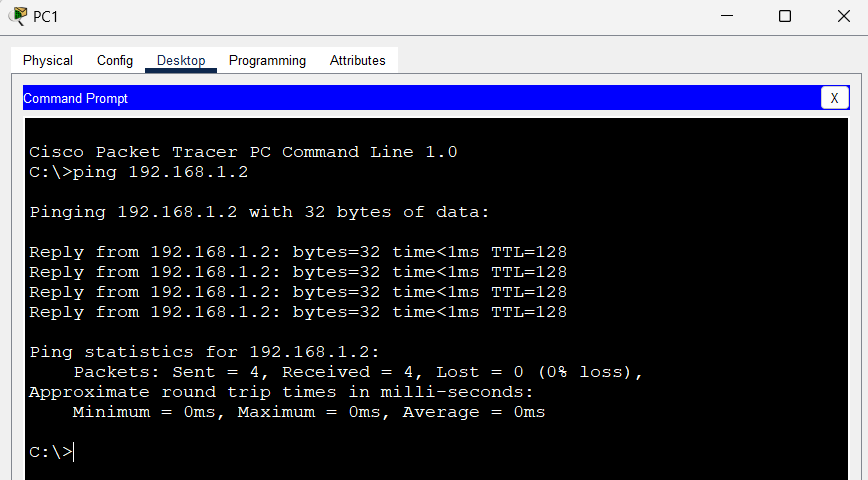
- Test the Connectivity:
Go to PC1 and open the Command Prompt from the Desktop tab.
Type ping 192.168.1.2 and press enter to check the connection between the two PCs.
You should see replies from 192.168.1.2, confirming the network is set up correctly.
Project Files
- Packet Tracer File: You can download the completed .pkt file from the repository to see the configured network.
Troubleshooting
No Connectivity: Ensure that the cables are connected to the correct ports and that the devices are powered on.
Incorrect IP Address: Double-check the IP configuration on both PCs and the router.
Router Configuration: Make sure the router interfaces are configured and not in a shutdown state.
License
This project is licensed under the MIT License - see the LICENSE file for details.
Cisco Packet Tracer: Connect Three Computers and two Routers with Switchs
Project Overview
This project demonstrates a basic network setup in Cisco Packet Tracer, where two computers are connected through three routers and two Switchs. The setup will allow the three computers to communicate with each other over the network.
Requirements
Cisco Packet Tracer: Version 7.0 or later
Basic understanding of networking concepts
Topology Overview
Router: The central device that connects the two computers.
Switch: To connect many machines via a router.
Computer 1 (PC1): The first computer in the network.
Computer 2 (PC2): The second computer in the network.
Computer 3 (Laptop1): The third computer in the network.
Connection Type: Ethernet cables (copper straight-through cables) are used to connect the devices.
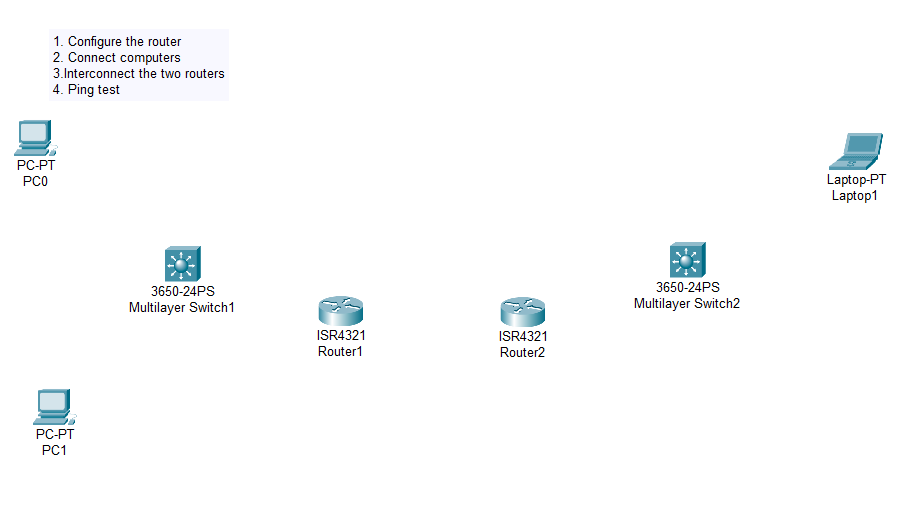
Steps to Create the Network
Launch Cisco Packet Tracer:
- Open Cisco Packet Tracer on your computer.
Add Devices to the Workspace:
- Drag and drop two Routers from the “Network Devices” section.
- Drag and drop two Switchs from the “Network Devices” section.
- Drag and drop two PCs and one laptop from the “End Devices” section.
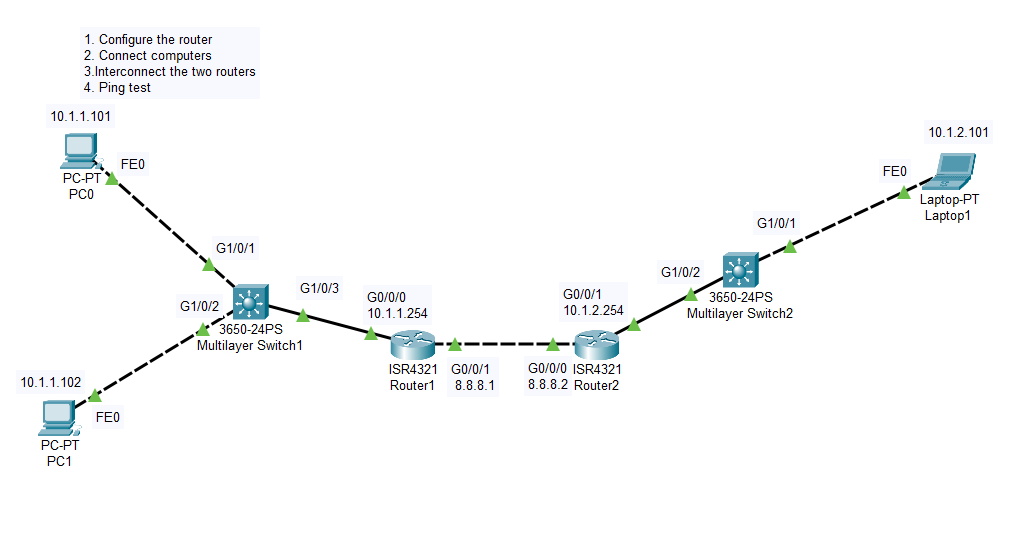
Connect the Devices:
Select the Copper Cross-Over Cable from the “Connections” section to connect two PC at the first Switch.
Click on PC0 and connect to the GigabitEthernet1/0/1 port on the Switch.
Repeat the process for PC2, connecting it to the Switch GigabitEthernet1/0/2 port.
Select the Copper Straight-Through Cable from the “Connections” section to connect the first Switch at the first Router.
Connect the Router’s GigabitEthernet0/0/0 port to the Switch’s GigabitEthernet1/0/3.
Select the Copper Cross-Over Cable from the “Connections” section to connect the two routers.
Connect the first Router’s GigabitEthernet0/0/1 at the second Router GigabitEthernet0/0/0.
Select Copper-Straight-Through Cable from the “Connections” section to connect the second Router to the second Switch.
Connect the second Router’s GigabitEthernet0/0/1 at the second Switch’s GigabitEthernet1/0/2.
Select the Copper Cross-Over Cable from the “Connections” section to connect the second Switch to the Laptop.
Connect the second Switch’s GigabitEthernet1/0/1 at the Laptop FastEthernet0.
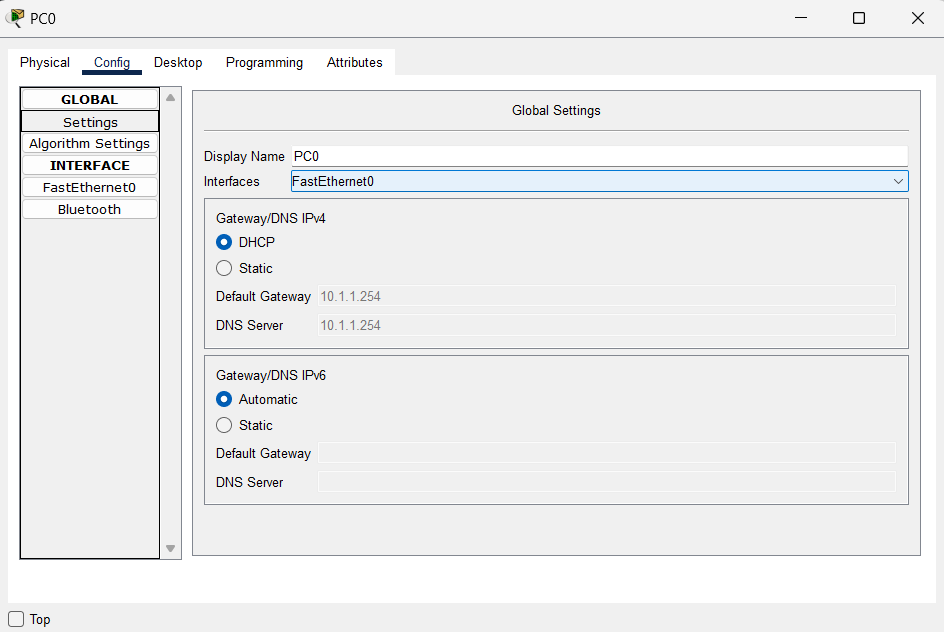
Configure IP Addresses:
For the PC0, PC1 and the Laptop, let check DHCP checkbox on.
Configure the Routers:
Click on the Router1 and go to the CLI tab.
Enter the following commands to configure the router:
Router> en
Router# conf t
Router(config)# host R1
R1(config)# int GigabitEthernet0/0/0
R1(config-if)# ip address 10.1.1.254 255.255.255.0
R1(config-if)# no shutdown
R1(config-if)# exit
R1(config)# int GigabitEthernet0/0/1
R1(config-if)# ip address 8.8.8.1
R1(config-if)# exit
R1(config)# ip route 10.1.2.0 255.255.255.0 8.8.8.2
R1(config-if)# exit
R1(config)# router rip
R1(config-router)# network 8.0.0.0
R1(config-router)# network 10.0.0.0
R1(config-router)# exit
Click on the Router2 and go to the CLI tab.
Enter the following commands to configure the router:
Router> en
Router# conf t
Router(config)# host R2
R2(config)# int GigabitEthernet0/0/1
R2(config-if)# ip address 10.1.2.254 255.255.255.0
R2(config-if)# no shutdown
R2(config-if)# exit
R2(config)# int GigabitEthernet0/0/0
R2(config-if)# ip address 8.8.8.2
R2(config-if)# exit
R2(config)# ip route 10.1.1.0 255.255.255.0 8.8.8.1
R2(config-if)# exit
R2(config)# router rip
R2(config-router)# network 8.0.0.0
R2(config-router)# network 10.0.0.0
R2(config-router)# exit
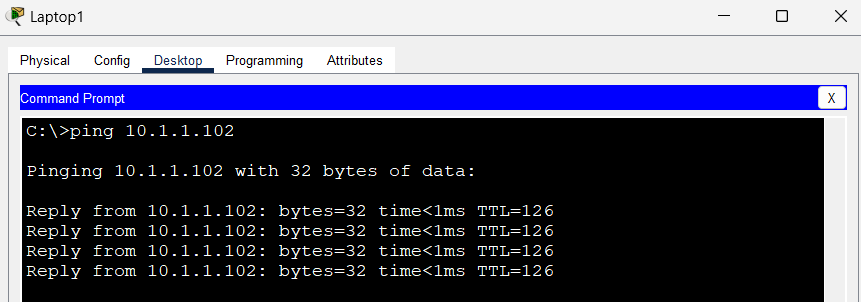
Test the Connectivity:
Go to PC1 and open the Command Prompt from the Desktop tab.
Enter ipconfig to show the ip generated, here 10.1.1.102
Go to Laptop and open the Command Prompt from the Desktop tab, type ping 10.1.1.102 and press enter to check the connection between the two PCs.
You should see replies from 10.1.1.102, confirming the network is set up correctly.
Project Files
- Packet Tracer File: You can download the completed .pkt file from the repository to see the configured network.
Troubleshooting
No Connectivity: Ensure that the cables are connected to the correct ports and that the devices are powered on.
Incorrect IP Address: Double-check the IP configuration on both PCs and the router.
Router Configuration: Make sure the router interfaces are configured and not in a shutdown state.
License
This project is licensed under the MIT License - see the LICENSE file for details.
Final Project
Cisco Packet Tracer: Connect Three Computers and two Routers with Switchs
Project Overview
This project demonstrates a basic network setup in Cisco Packet Tracer, where two computers are connected through three routers and two Switchs. The setup will allow the three computers to communicate with each other over the network.
Requirements
Cisco Packet Tracer: Version 7.0 or later
Basic understanding of networking concepts
Topology Overview
Router: The central device that connects the two computers.
Switch: To connect many machines via a router.
Computer 1 (PC1): The first computer in the network.
Computer 2 (PC2): The second computer in the network.
Computer 3 (Laptop1): The third computer in the network.
Connection Type: Ethernet cables (copper straight-through cables) are used to connect the devices.
Steps to Create the Network
Launch Cisco Packet Tracer:
- Open Cisco Packet Tracer on your computer.
Add Devices to the Workspace:
- Drag and drop two Routers from the “Network Devices” section.
- Drag and drop two Switchs from the “Network Devices” section.
- Drag and drop two PCs and one laptop from the “End Devices” section.
Connect the Devices:
Select the Copper Cross-Over Cable from the “Connections” section to connect two PC at the first Switch.
Click on PC0 and connect to the GigabitEthernet1/0/1 port on the Switch.
Repeat the process for PC2, connecting it to the Switch GigabitEthernet1/0/2 port.
Select the Copper Straight-Through Cable from the “Connections” section to connect the first Switch at the first Router.
Connect the Router’s GigabitEthernet0/0/0 port to the Switch’s GigabitEthernet1/0/3.
Select the Copper Cross-Over Cable from the “Connections” section to connect the two routers.
Connect the first Router’s GigabitEthernet0/0/1 at the second Router GigabitEthernet0/0/0.
Select Copper-Straight-Through Cable from the “Connections” section to connect the second Router to the second Switch.
Connect the second Router’s GigabitEthernet0/0/1 at the second Switch’s GigabitEthernet1/0/2.
Select the Copper Cross-Over Cable from the “Connections” section to connect the second Switch to the Laptop.
Connect the second Switch’s GigabitEthernet1/0/1 at the Laptop FastEthernet0.
Configure IP Addresses:
For the PC0, PC1 and the Laptop, let check DHCP checkbox on.
Configure the Routers:
Click on the Router1 and go to the CLI tab.
Enter the following commands to configure the router:
Router> en
Router# conf t
Router(config)# host R1
R1(config)# int GigabitEthernet0/0/0
R1(config-if)# ip address 10.1.1.254 255.255.255.0
R1(config-if)# no shutdown
R1(config-if)# exit
R1(config)# int GigabitEthernet0/0/1
R1(config-if)# ip address 8.8.8.1
R1(config-if)# exit
R1(config)# ip route 10.1.2.0 255.255.255.0 8.8.8.2
R1(config-if)# exit
R1(config)# router rip
R1(config-router)# network 8.0.0.0
R1(config-router)# network 10.0.0.0
R1(config-router)# exit
Click on the Router2 and go to the CLI tab.
Enter the following commands to configure the router:
Router> en
Router# conf t
Router(config)# host R2
R2(config)# int GigabitEthernet0/0/1
R2(config-if)# ip address 10.1.2.254 255.255.255.0
R2(config-if)# no shutdown
R2(config-if)# exit
R2(config)# int GigabitEthernet0/0/0
R2(config-if)# ip address 8.8.8.2
R2(config-if)# exit
R2(config)# ip route 10.1.1.0 255.255.255.0 8.8.8.1
R2(config-if)# exit
R2(config)# router rip
R2(config-router)# network 8.0.0.0
R2(config-router)# network 10.0.0.0
R2(config-router)# exit
Test the Connectivity:
Go to PC1 and open the Command Prompt from the Desktop tab.
Enter ipconfig to show the ip generated, here 10.1.1.102
Go to Laptop and open the Command Prompt from the Desktop tab, type ping 10.1.1.102 and press enter to check the connection between the two PCs.
You should see replies from 10.1.1.102, confirming the network is set up correctly.
Project Files
- Packet Tracer File: You can download the completed .pkt file from the repository to see the configured network.
Troubleshooting
No Connectivity: Ensure that the cables are connected to the correct ports and that the devices are powered on.
Incorrect IP Address: Double-check the IP configuration on both PCs and the router.
Router Configuration: Make sure the router interfaces are configured and not in a shutdown state.
License
This project is licensed under the MIT License - see the LICENSE file for details.